IDE Debugging
Overview
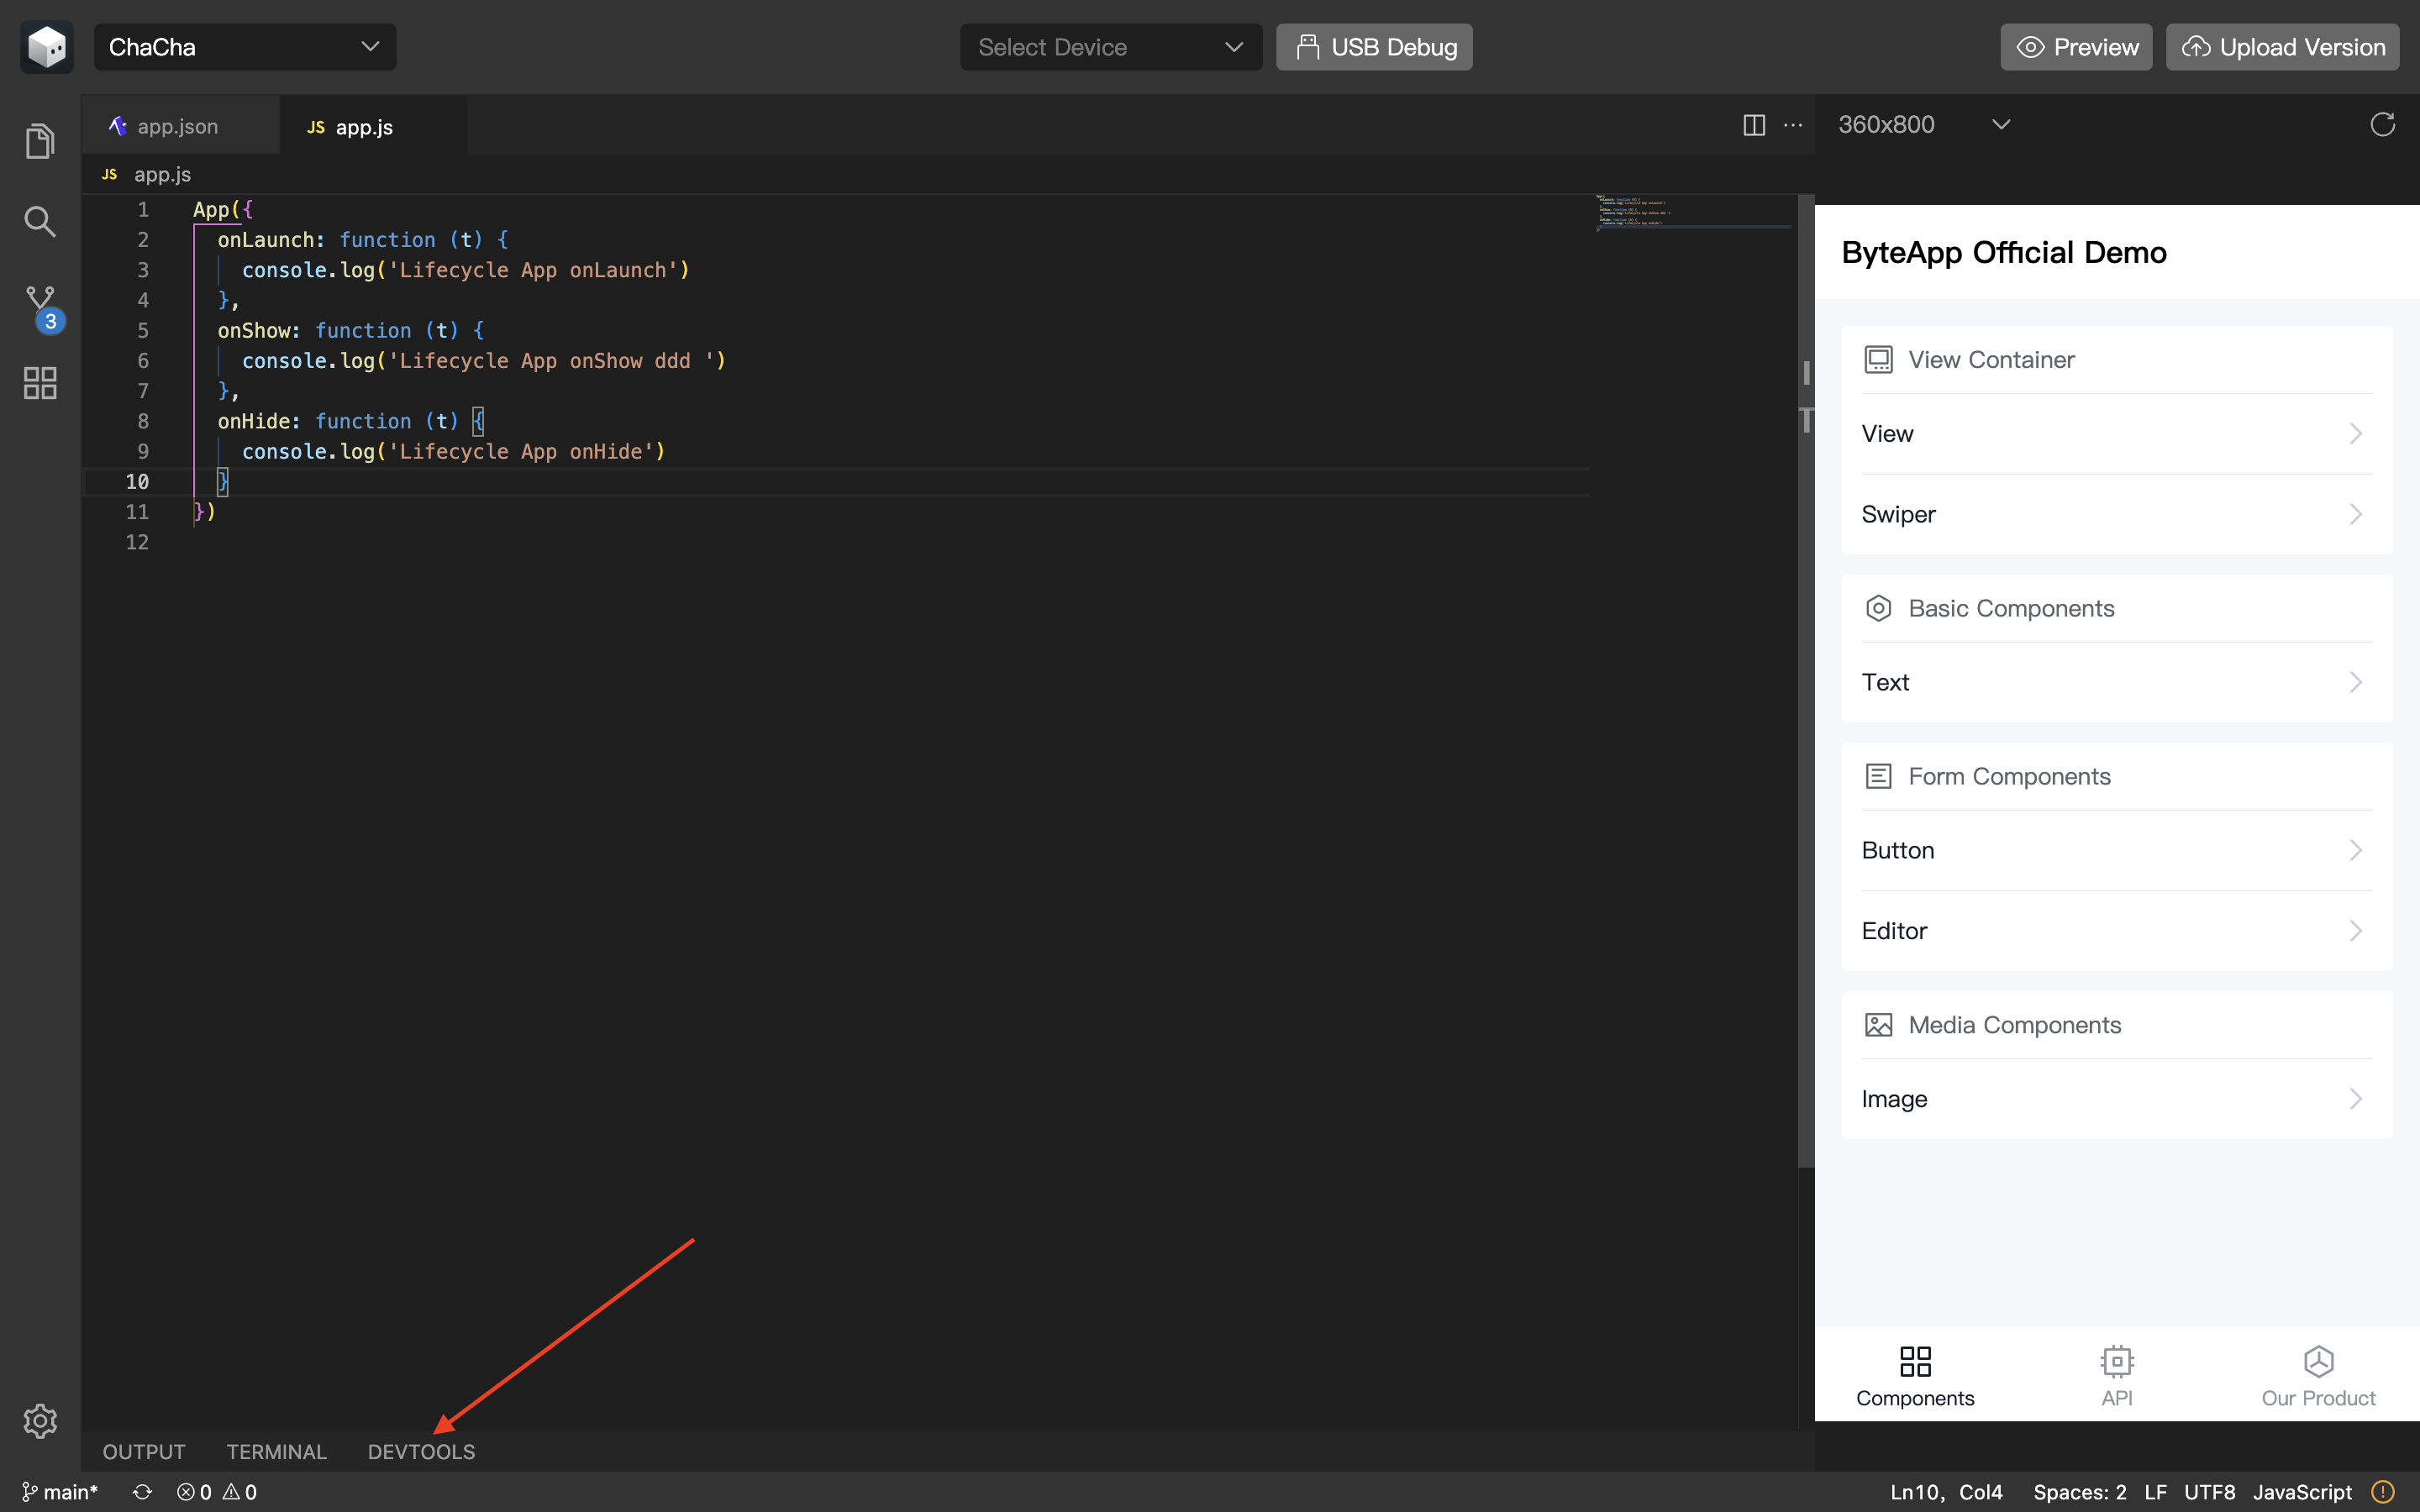
IDE provides two debugging methods, simulator + debugging tools and USB real device debugging, for developers to perform debugging operations. Developers can choose the debugging method according to their needs.
Simulator + Debugging Tools
The simulator emulates some of the real device APIs and is equipped with debugging tools. It is recommended to first complete the debugging of basic functions and styles in the simulator, and then verify and debug on a real device. The final running effect should be based on the real device.
Simulator
The simulator provides the following functions:
- Device Simulation
- Compilation Log, Compilation Error Prompt, Refresh

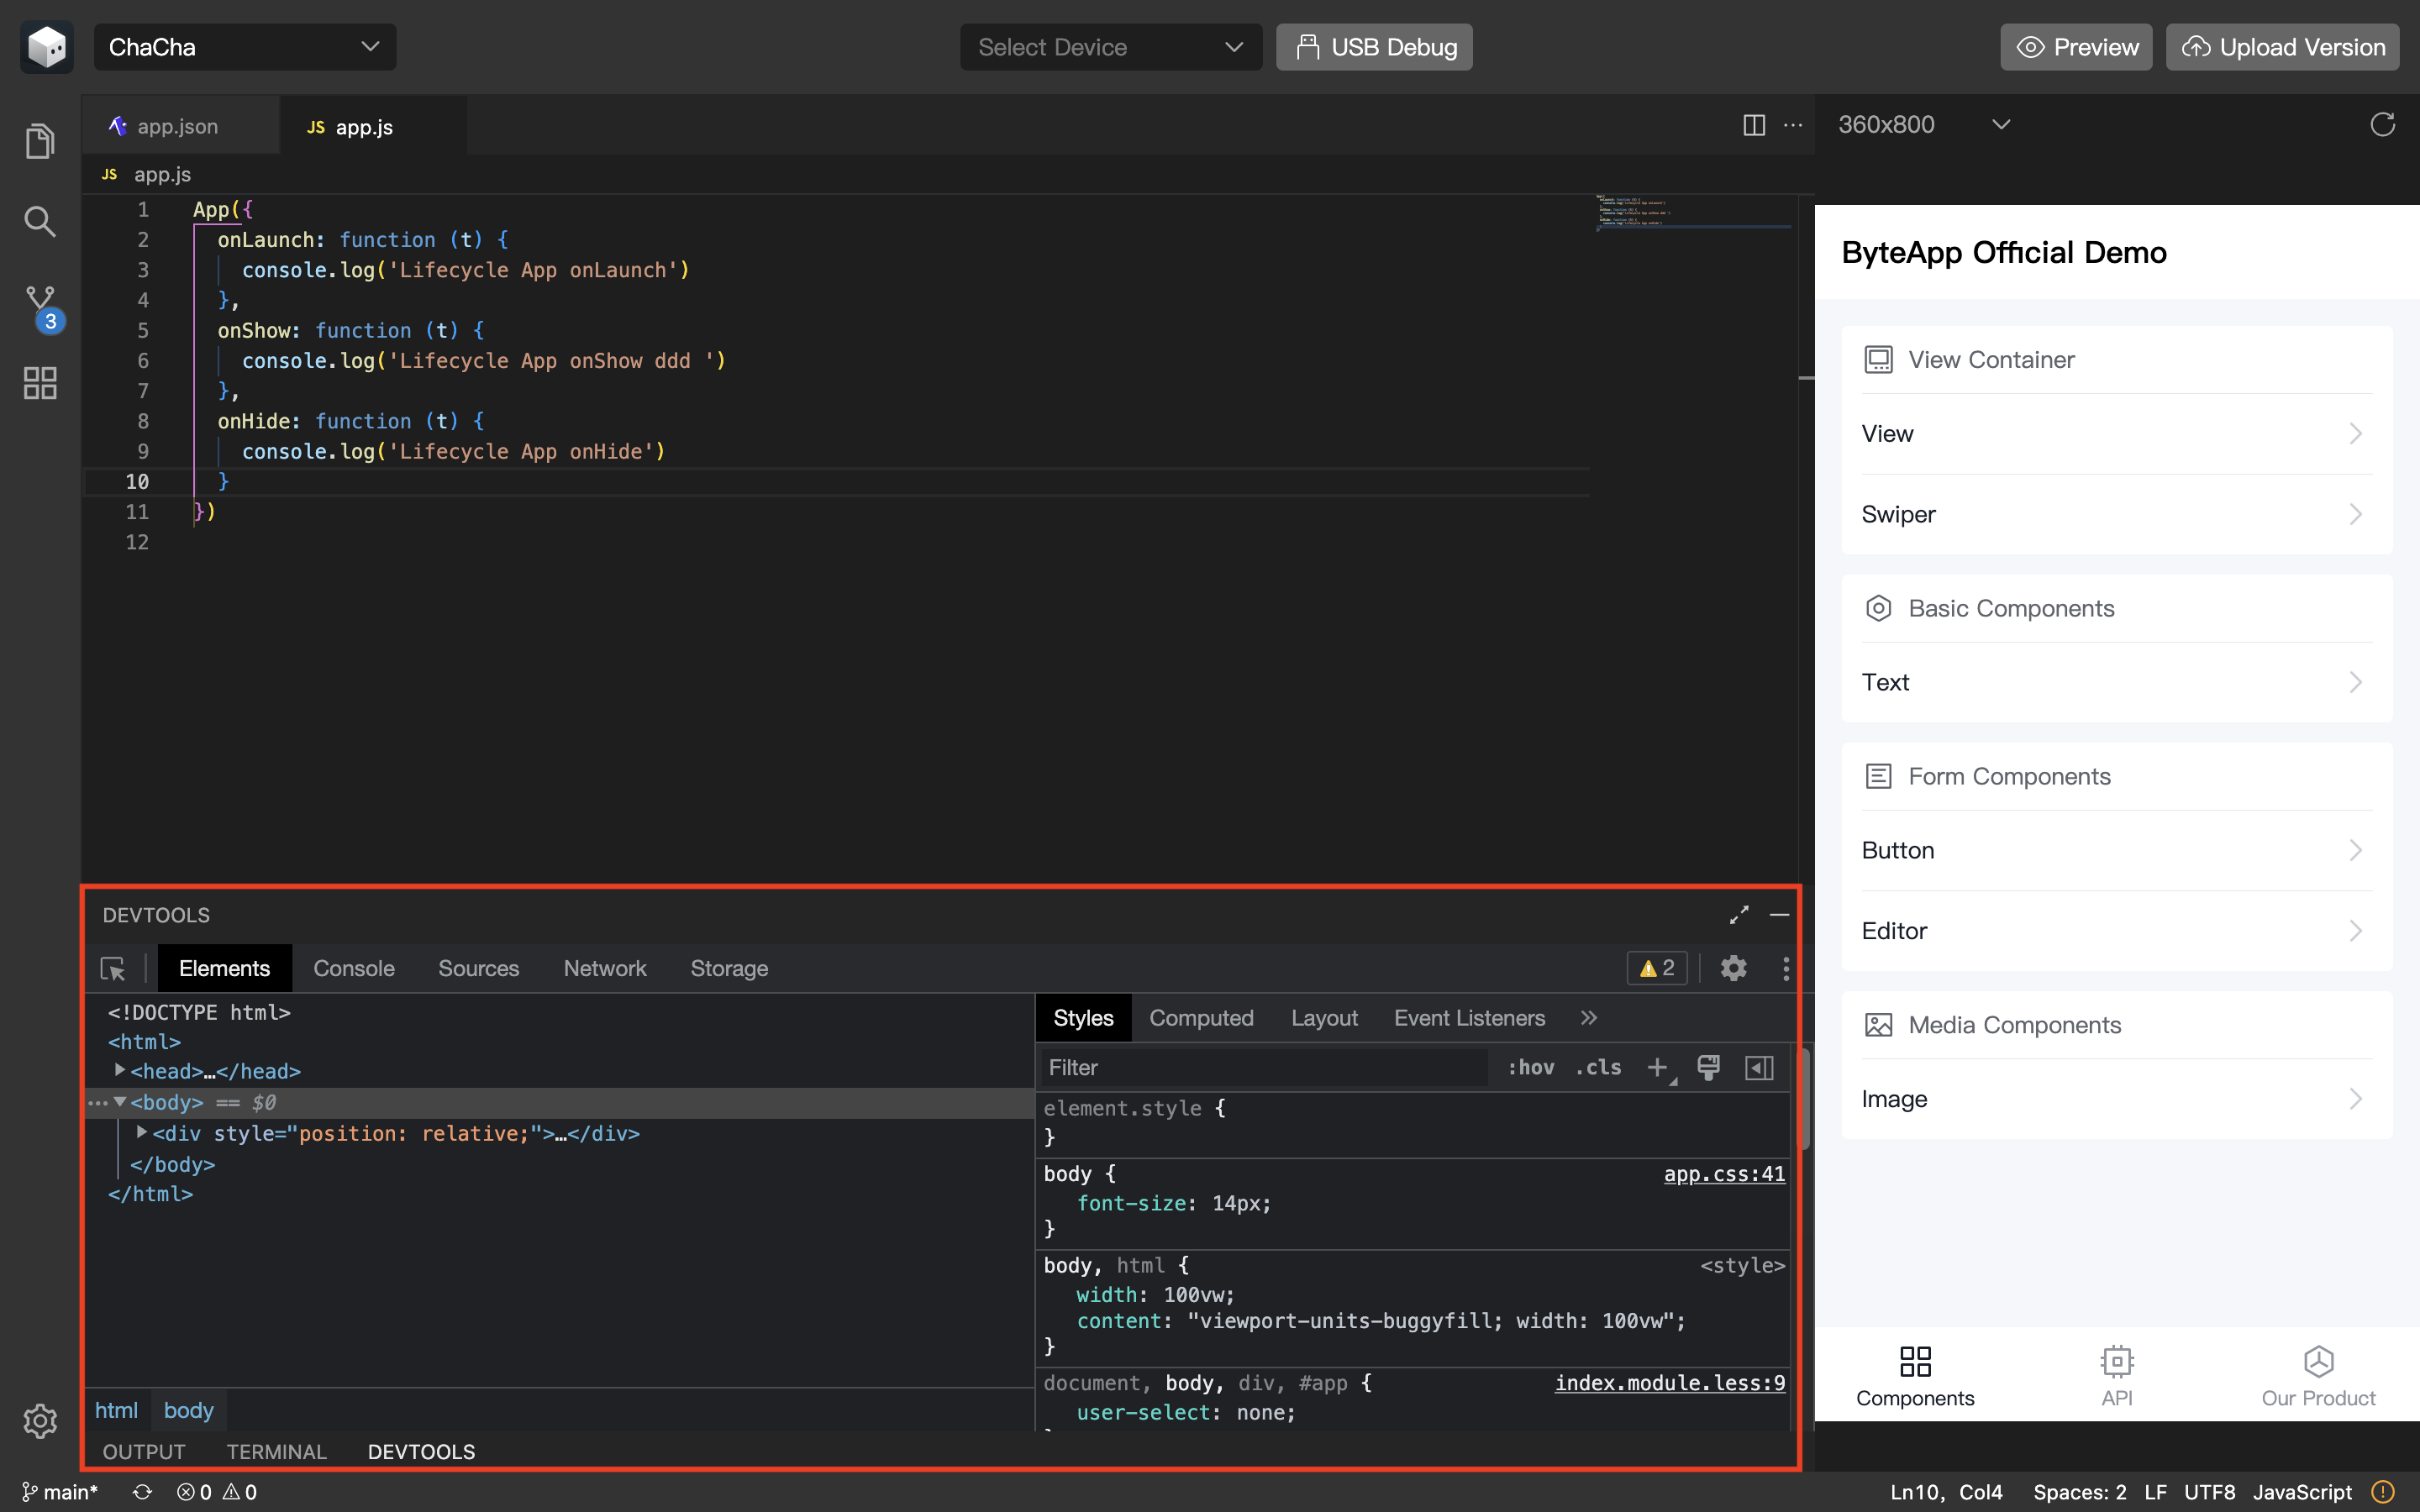
Debugging Tools
In conjunction with the simulator, the IDE provides a customized Chrome DevTools. The default displays include:
- Elements: DOM and CSS debugging based on mini program elements
- Console: Viewing run logs and errors
- Sources: Source code viewing and breakpoint debugging
- Network: Viewing network resources and requests

API Mock
Currently, the simulator supports only a subset of mini program APIs. To prevent developers from being hindered in their development process when using APIs not implemented in the simulator, the developer tools provide an API Mock solution based on configuration. Configure the APIs you want to mock in the configuration file and set the active field of the corresponding configuration option for that API to true; calls to that API within the simulator will return the configured result. To disable Mock for a particular API, simply change the active field of the corresponding configuration option for that API to false.
Note: This feature is only available in IDE versions 0.11.0 and later.
The specific configuration method is as follows:
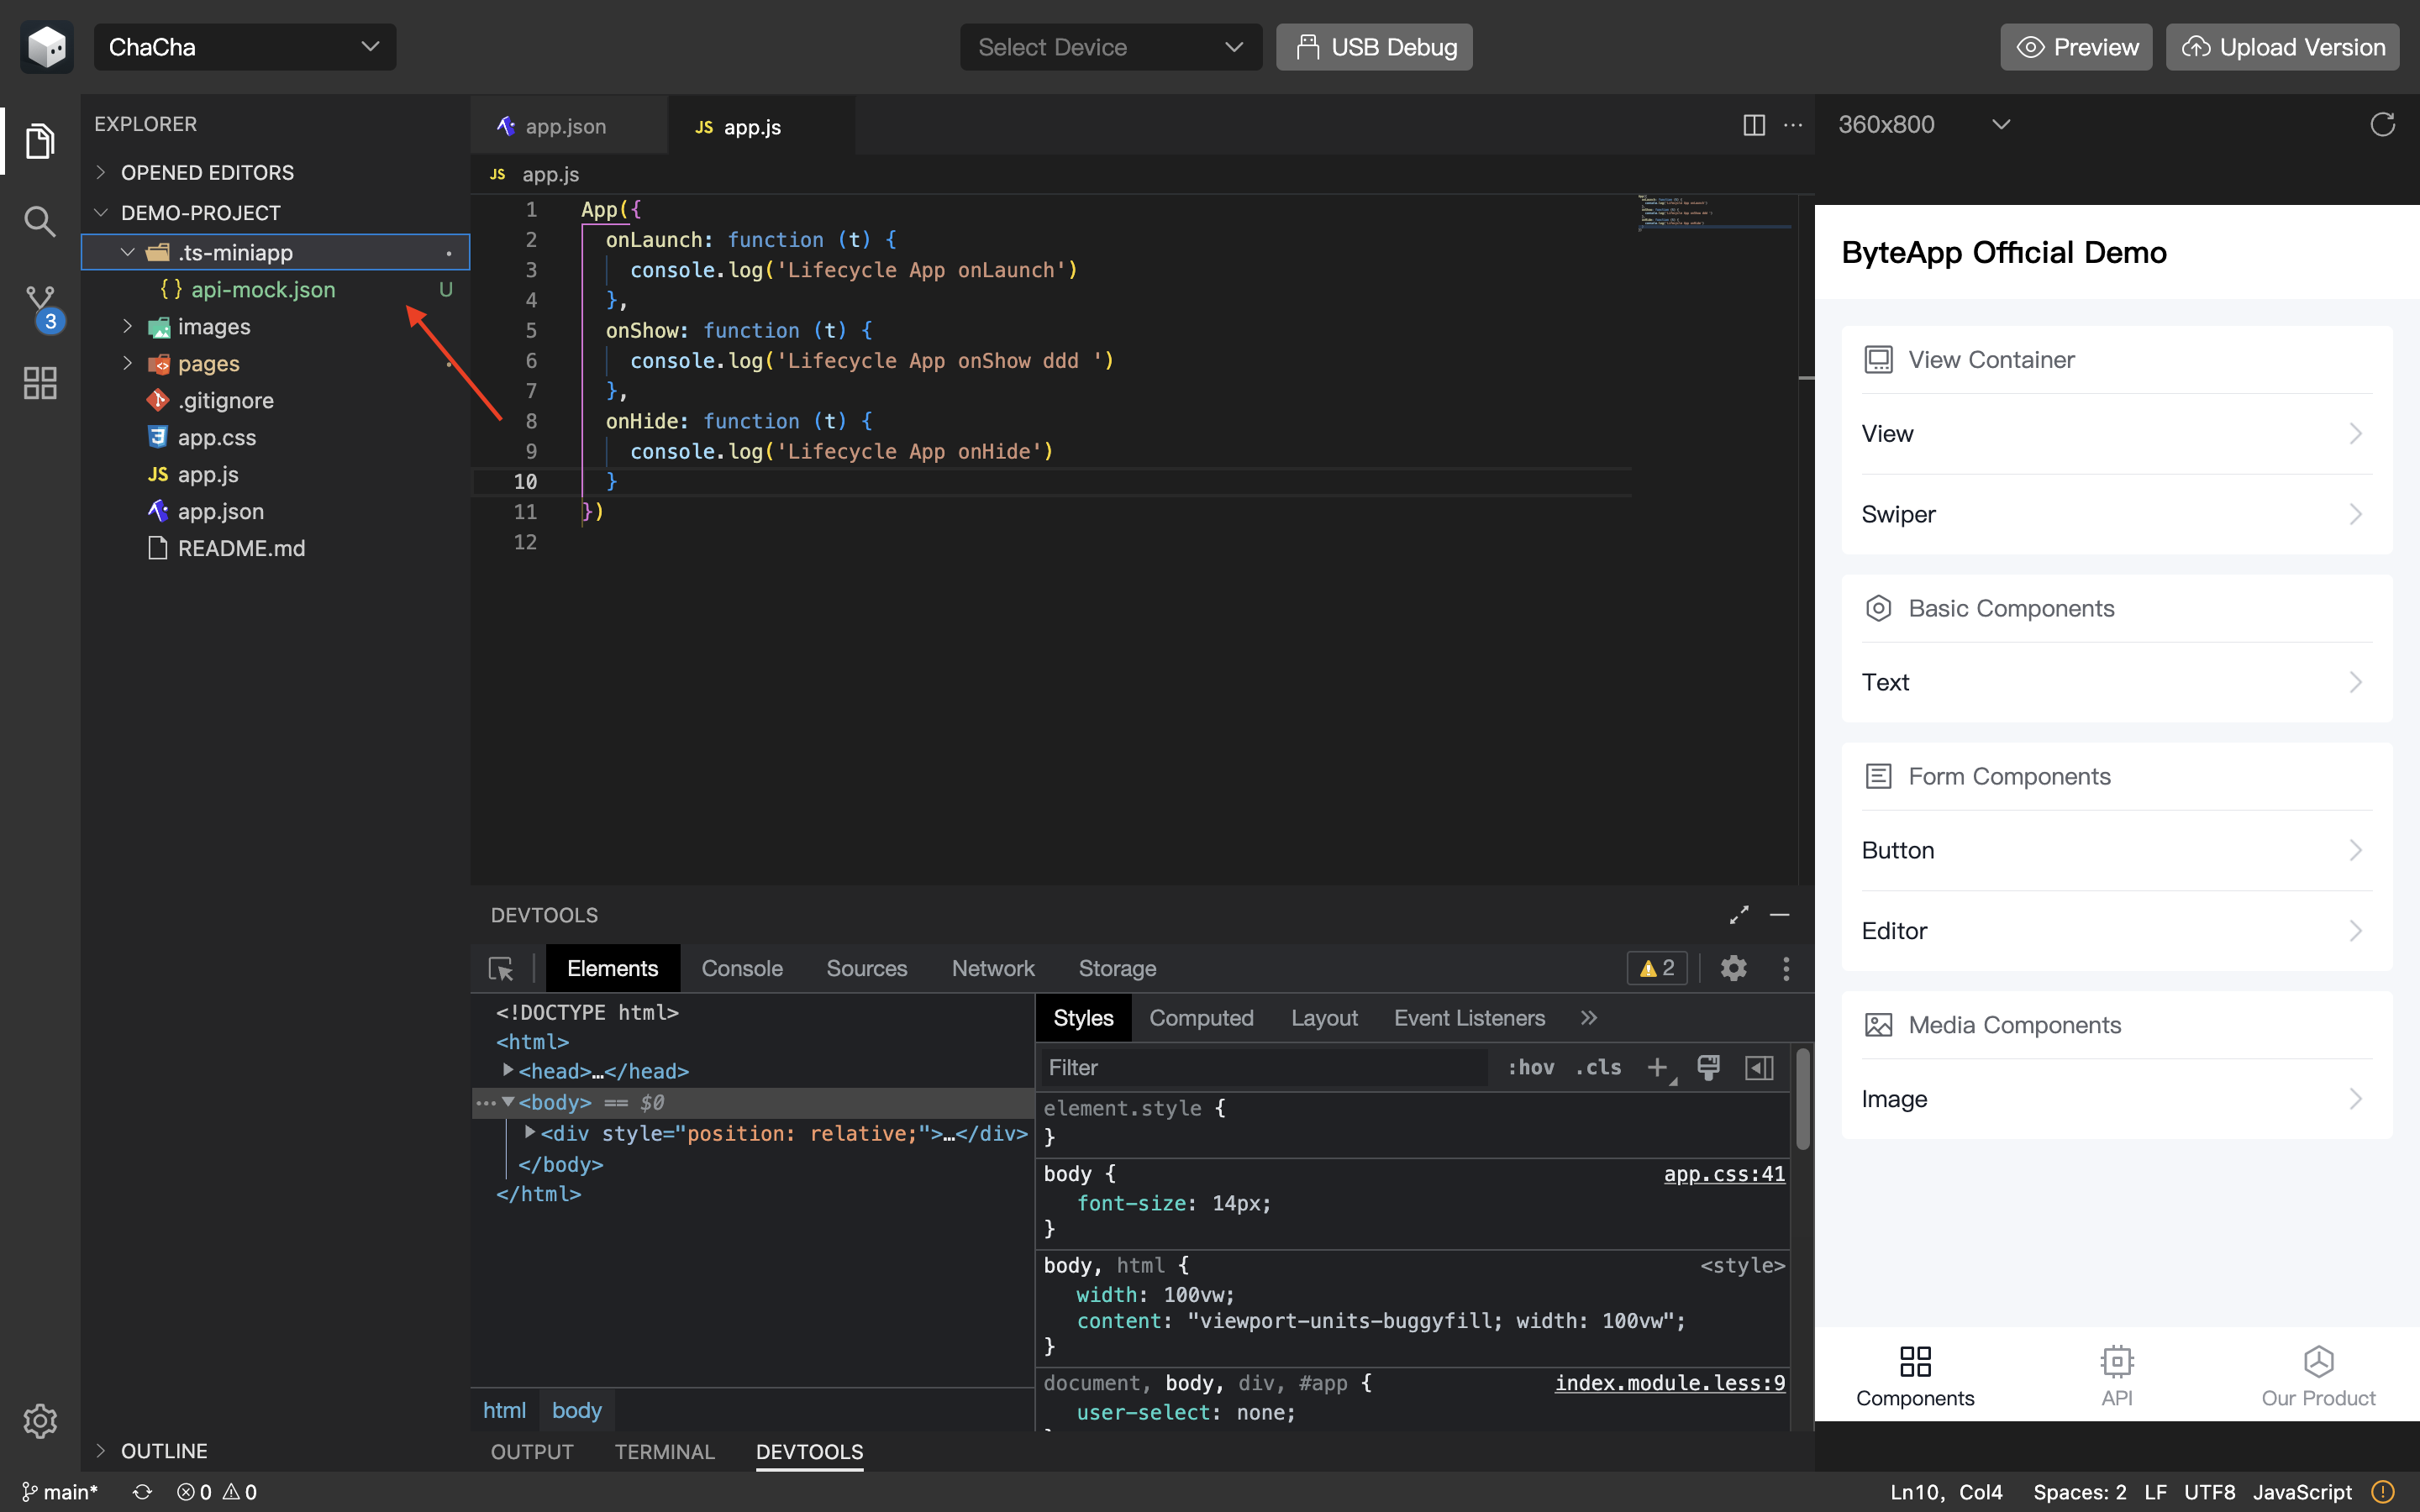
Create a .ts-miniapp directory in the root directory of the project and create a configuration file named api-mock.json within that directory.

The API Mock configuration rules are defined as follows:
type APIMockConfig = Array<{
    active: boolean;
    api: string;
    response: {
        success: boolean;
        payload: any;
    }
}>
- API Mock Configuration Example
[
  {
    "active": true,
    "api": "getLocation",
    "response": {
      "success": true,
      "payload": {
        "countryCode": "",
        "latitude": "31.1865546",
        "longitude": "121.6098457",
      }
    }
  }
]
USB Real Device Debugging
In USB real device debugging mode, the IDE and the mobile device establish a connection. On the IDE side, you can perform breakpoint setting, runtime information inspection, Network/Storage information viewing, and remote log viewing, etc. For more information, see Mini Program Debugging on a Real Device.