Mini Program Debugging on a Real Device
Overview
In order to facilitate debugging on real devices, the developer tool provides USB debugging functionality. By utilizing USB debugging, you can achieve the following operations:
- View the structure and styles of the Mini Program interface in the IDE (currently supports only HTML, support for Mini Program DLT will be added in the future).
- View console information on the connected device in the IDE.
- Debug the Mini Program on the connected device with breakpoints in the IDE.
- In remote debugging, you need to click the USB Debugging button again after each code modification to automatically open the Mini Program on the device and perform remote debugging.
Operation Guide
Ensure that the smartphone to be debugged has MiniApp installed. If not installed, you can go to the MiniApp download page, download and install MiniApp.
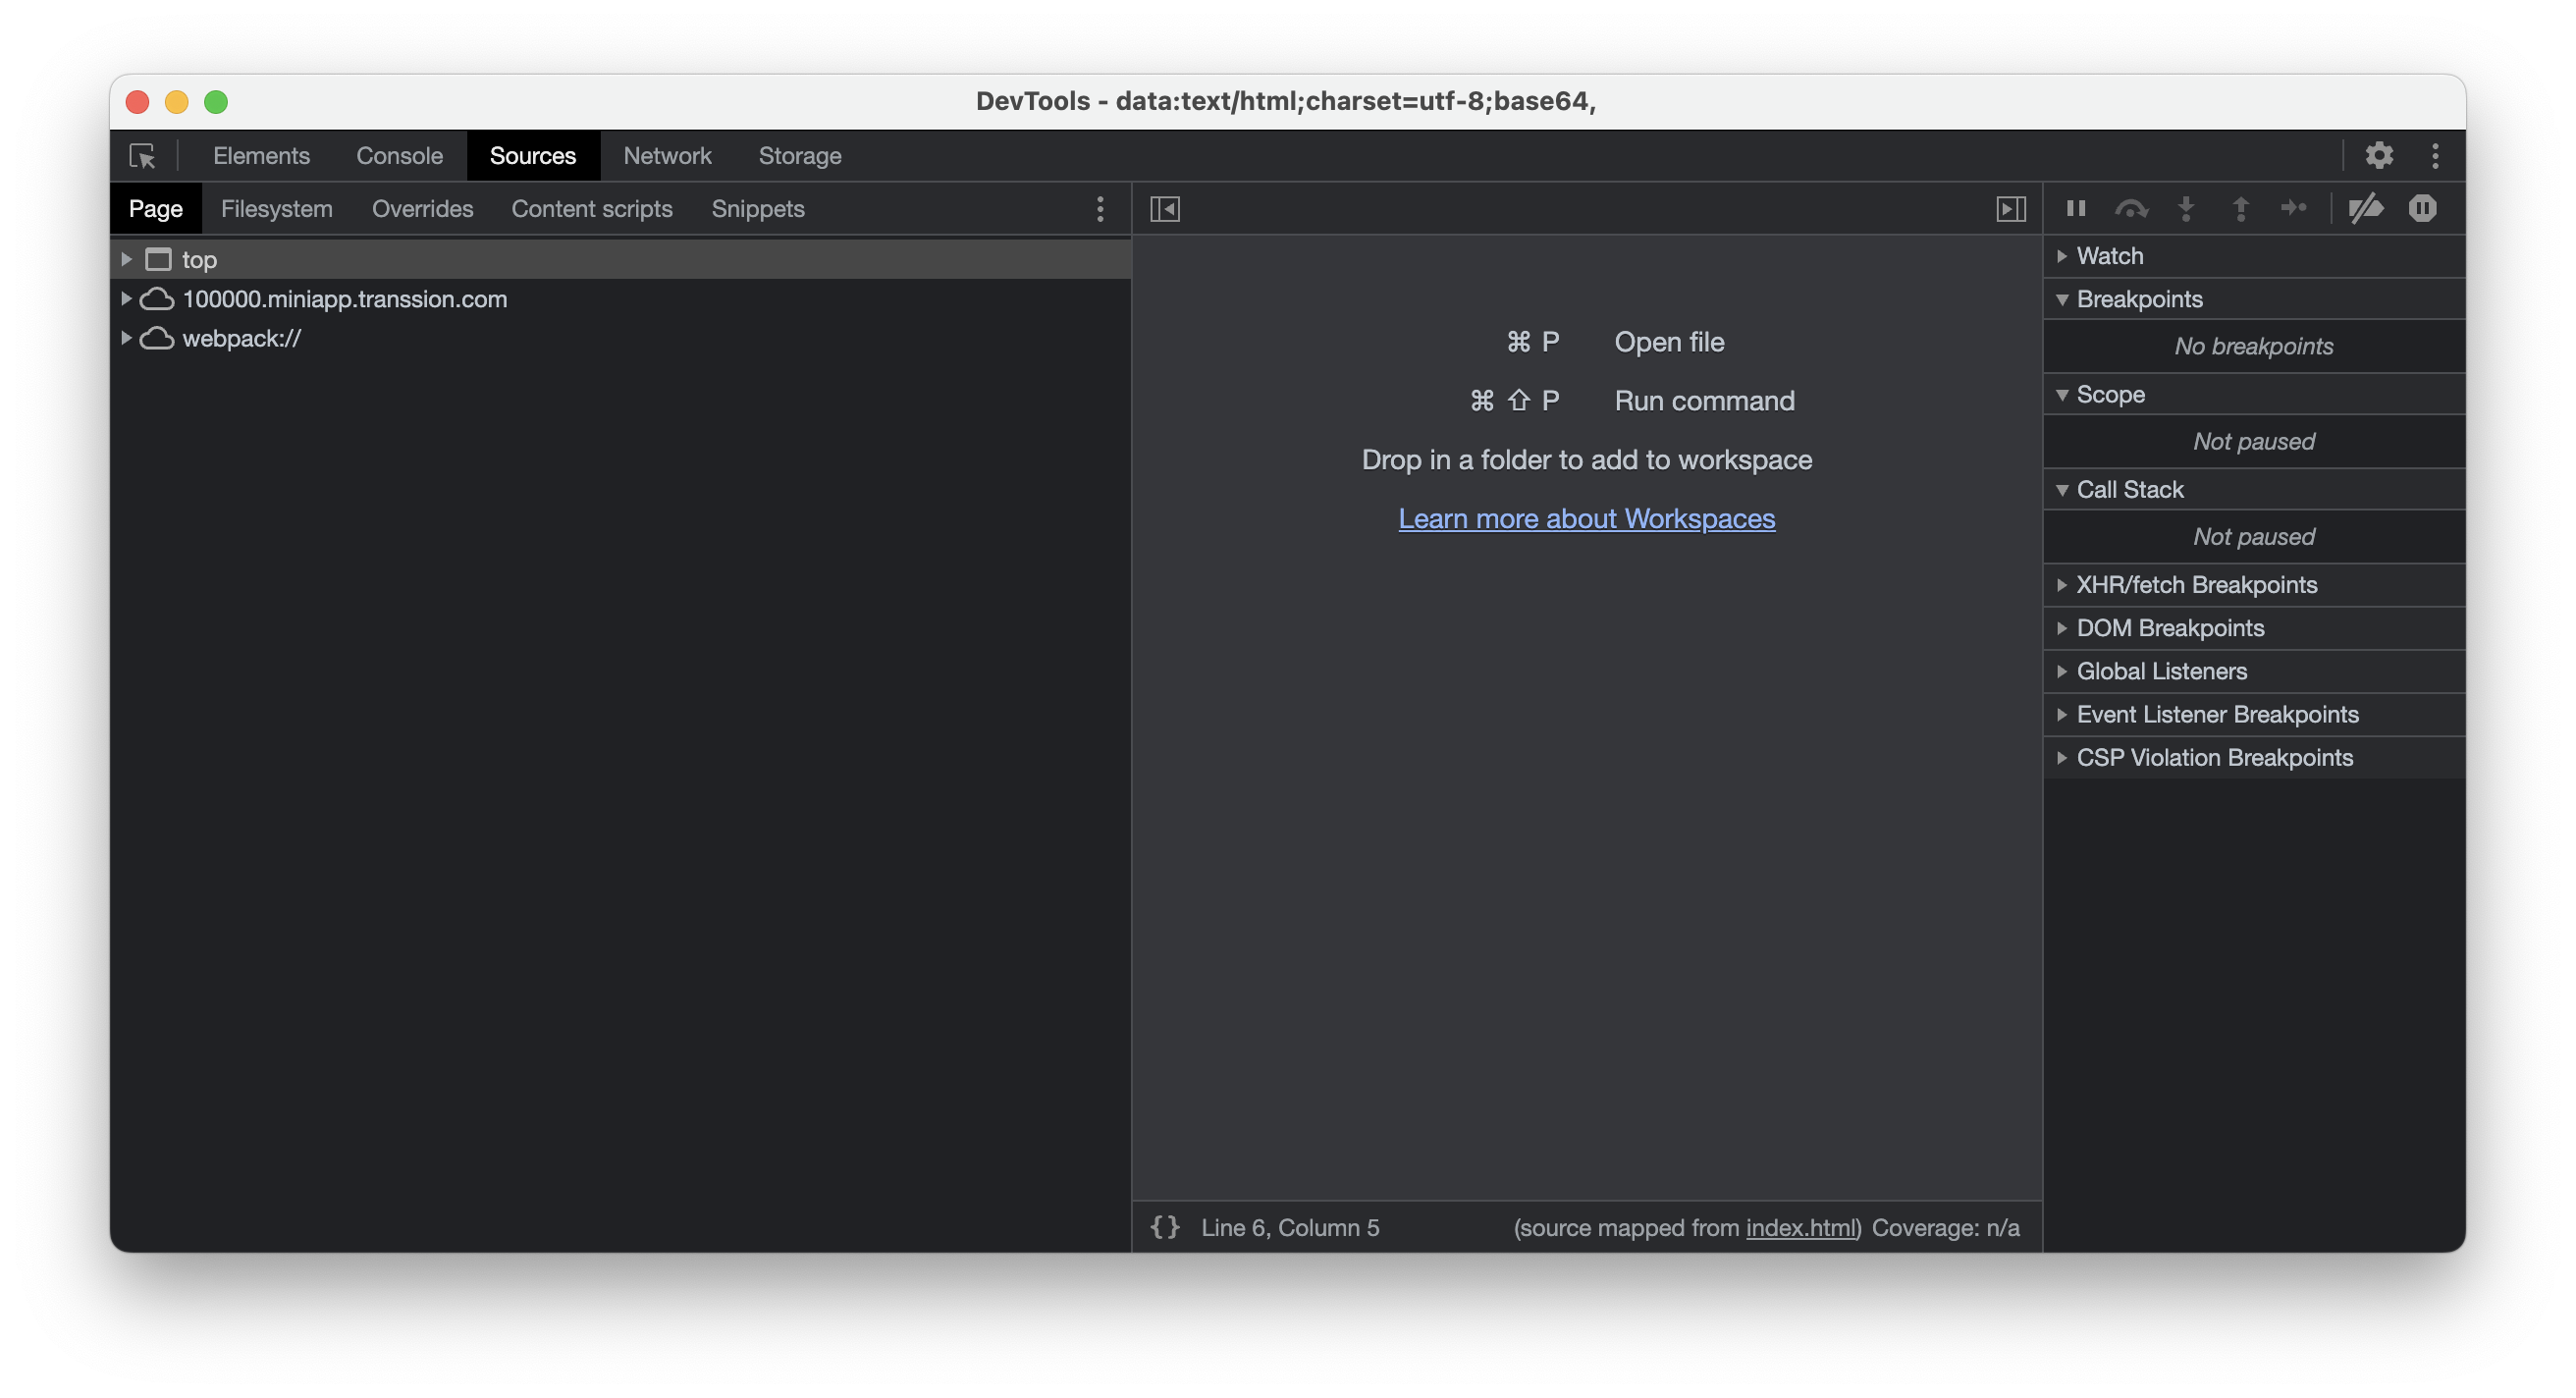
Click USB Debugging in the toolbar at the top right. The Mini Program will automatically open on the connected device, and the IDE will open the debugger.

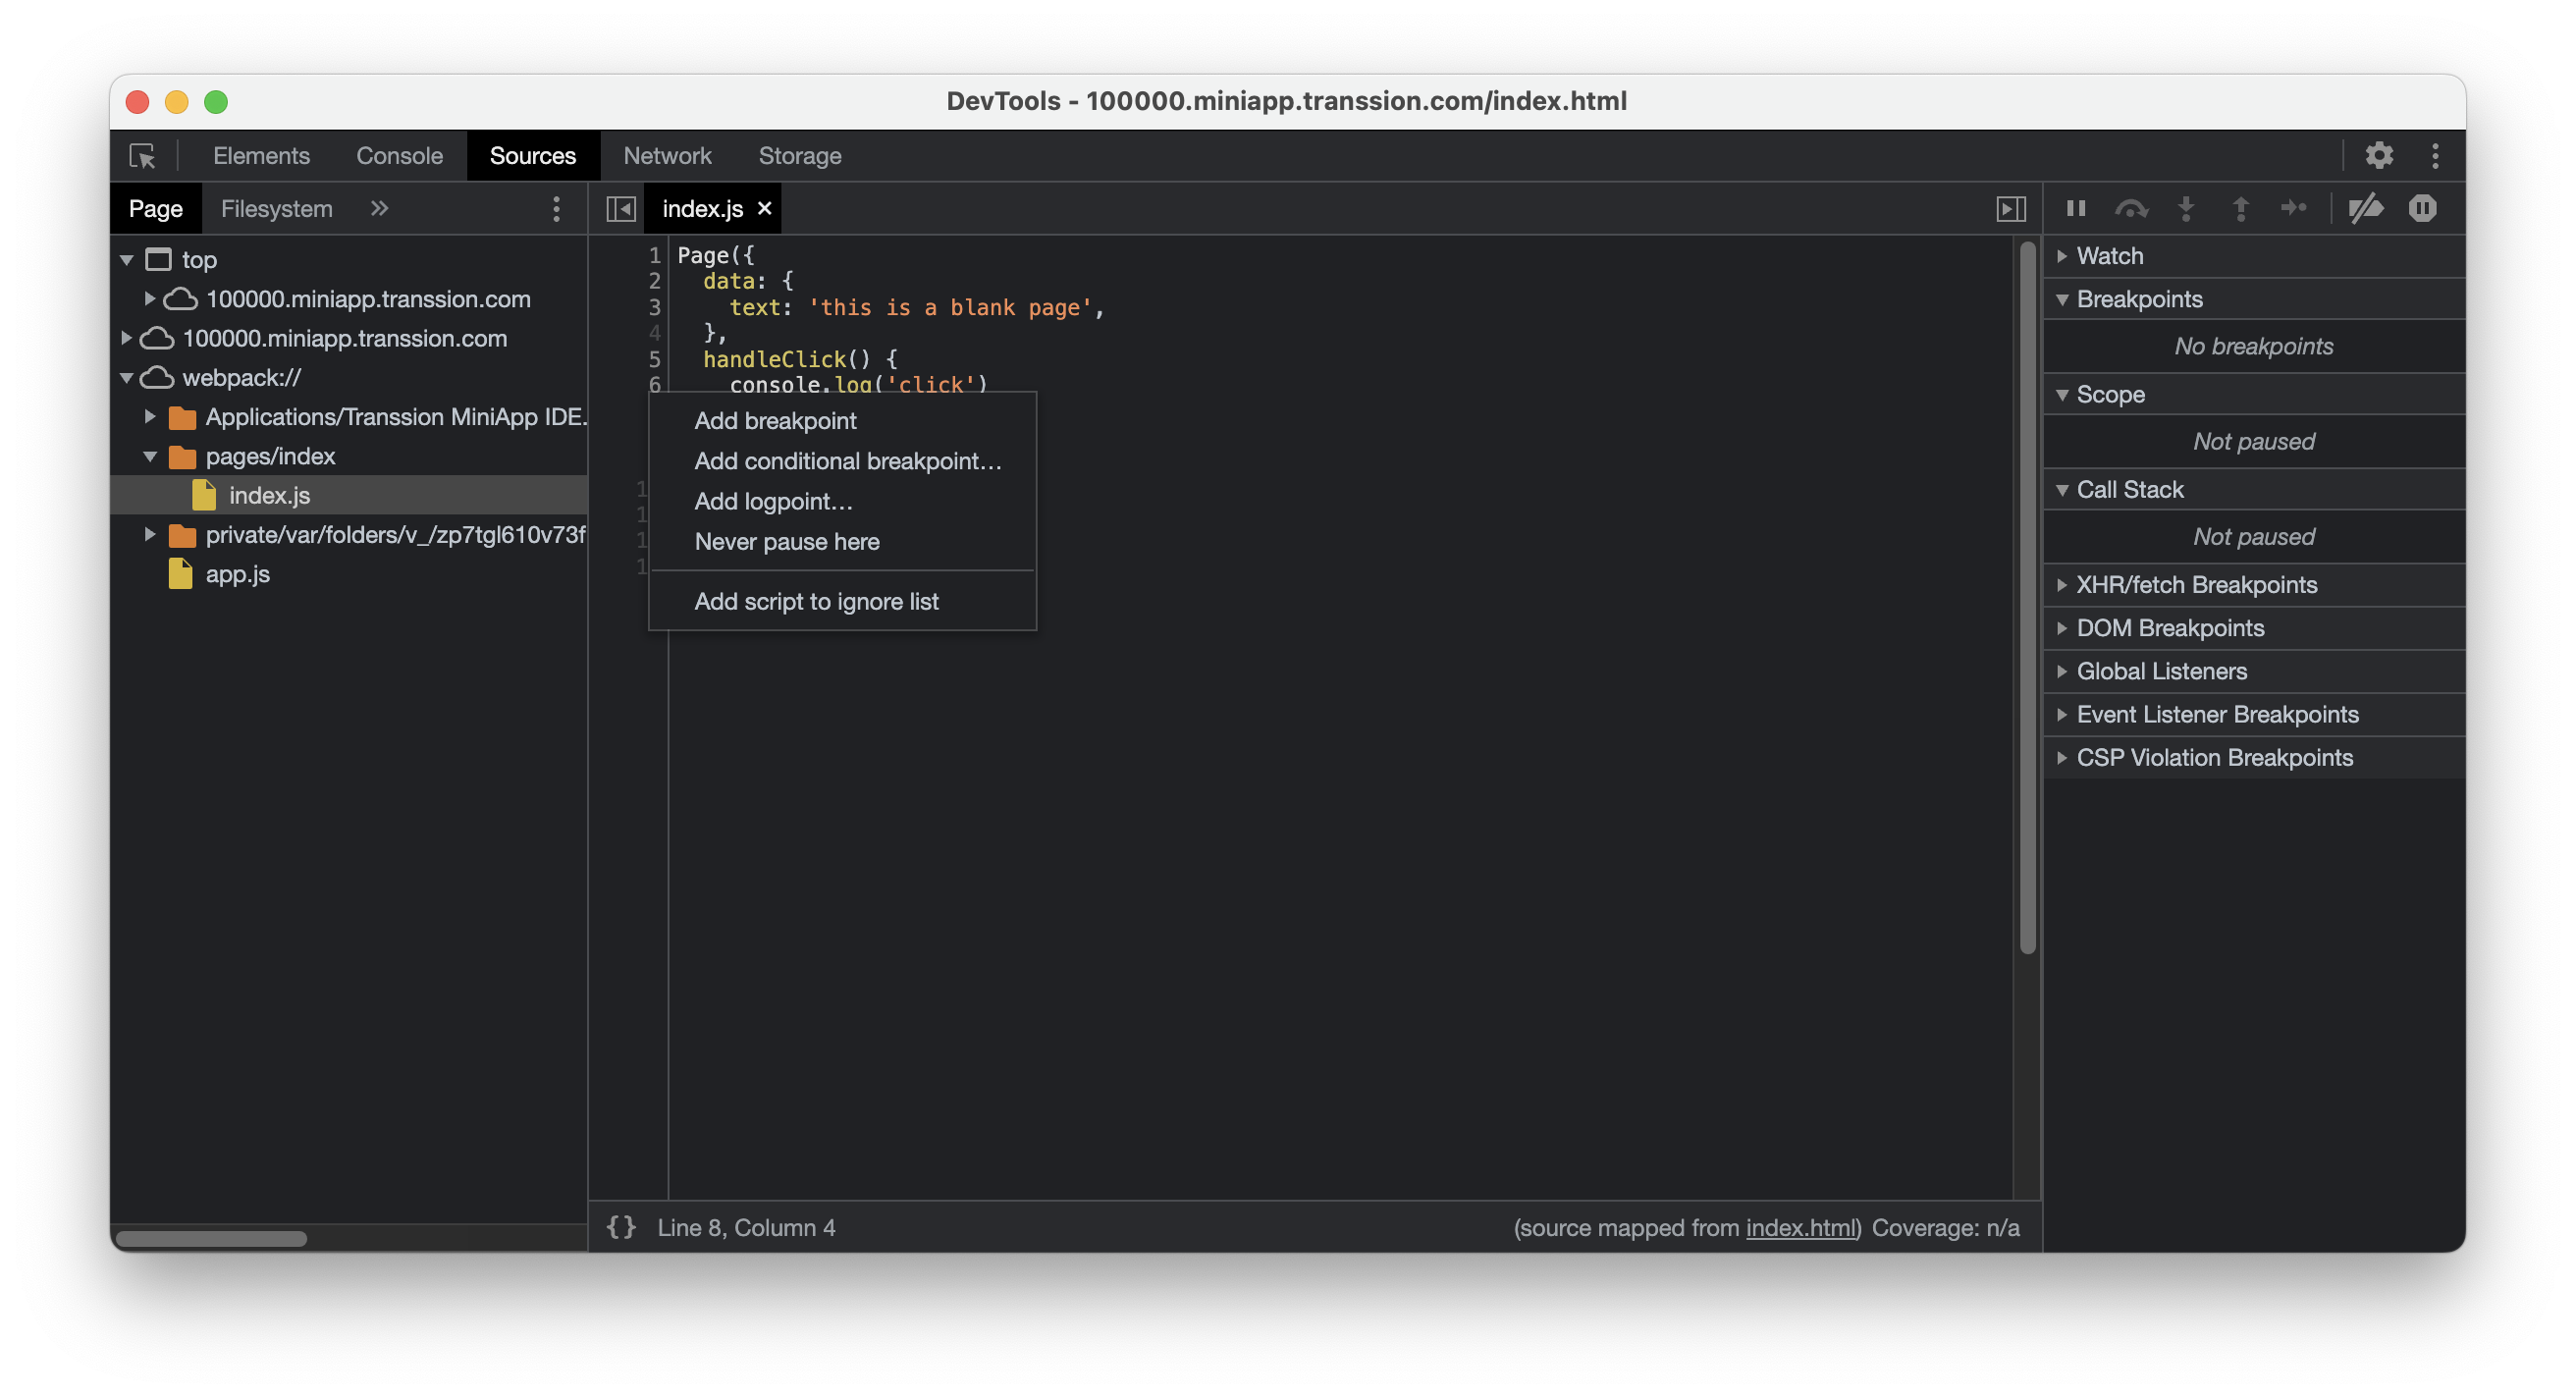
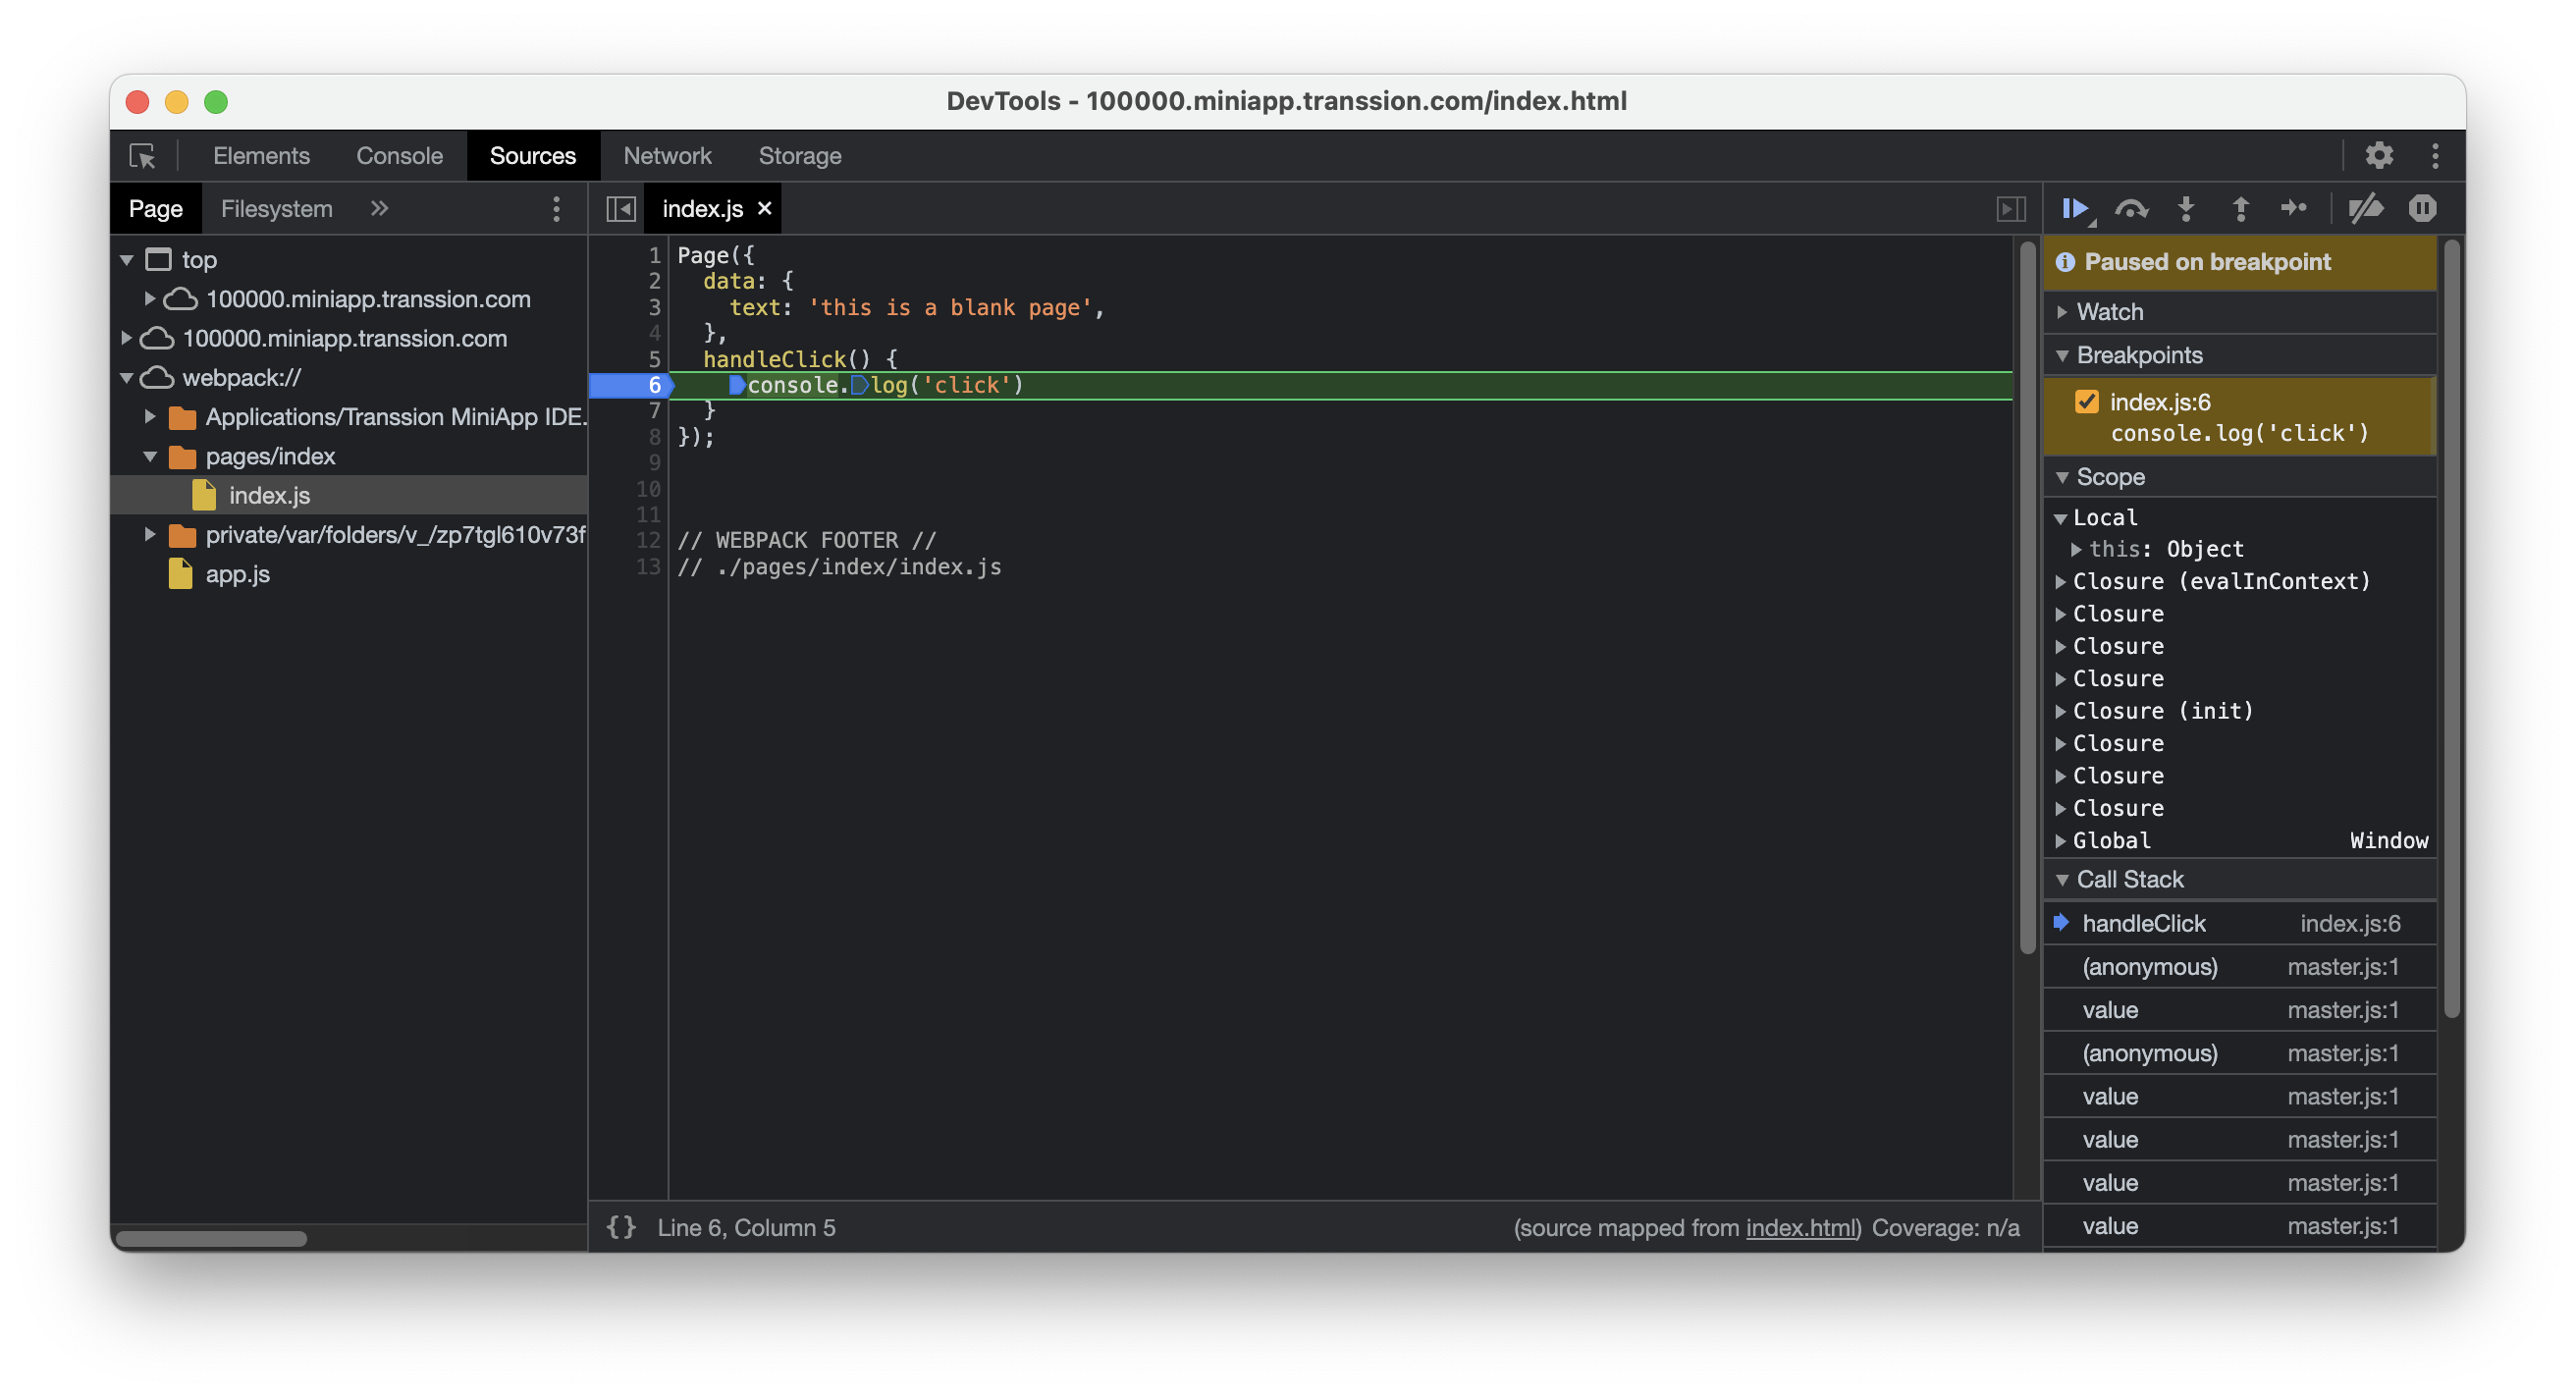
In the debugger, find the corresponding Mini Program page JS file in the "source" section. Right-click on the code line where you want to set a breakpoint and select "Add breakpoint". Once the breakpoint is successfully set, the background color of the line numbers on the left will turn blue.

Perform breakpoint debugging. When the breakpoint is hit, there will be a mask prompt on the real device.
