Debugging an H5 Shell MiniApp
Currently, the debugging method for MiniShell H5 only supports USB debugging
Open the debugging interface of an H5 Shell MiniApp
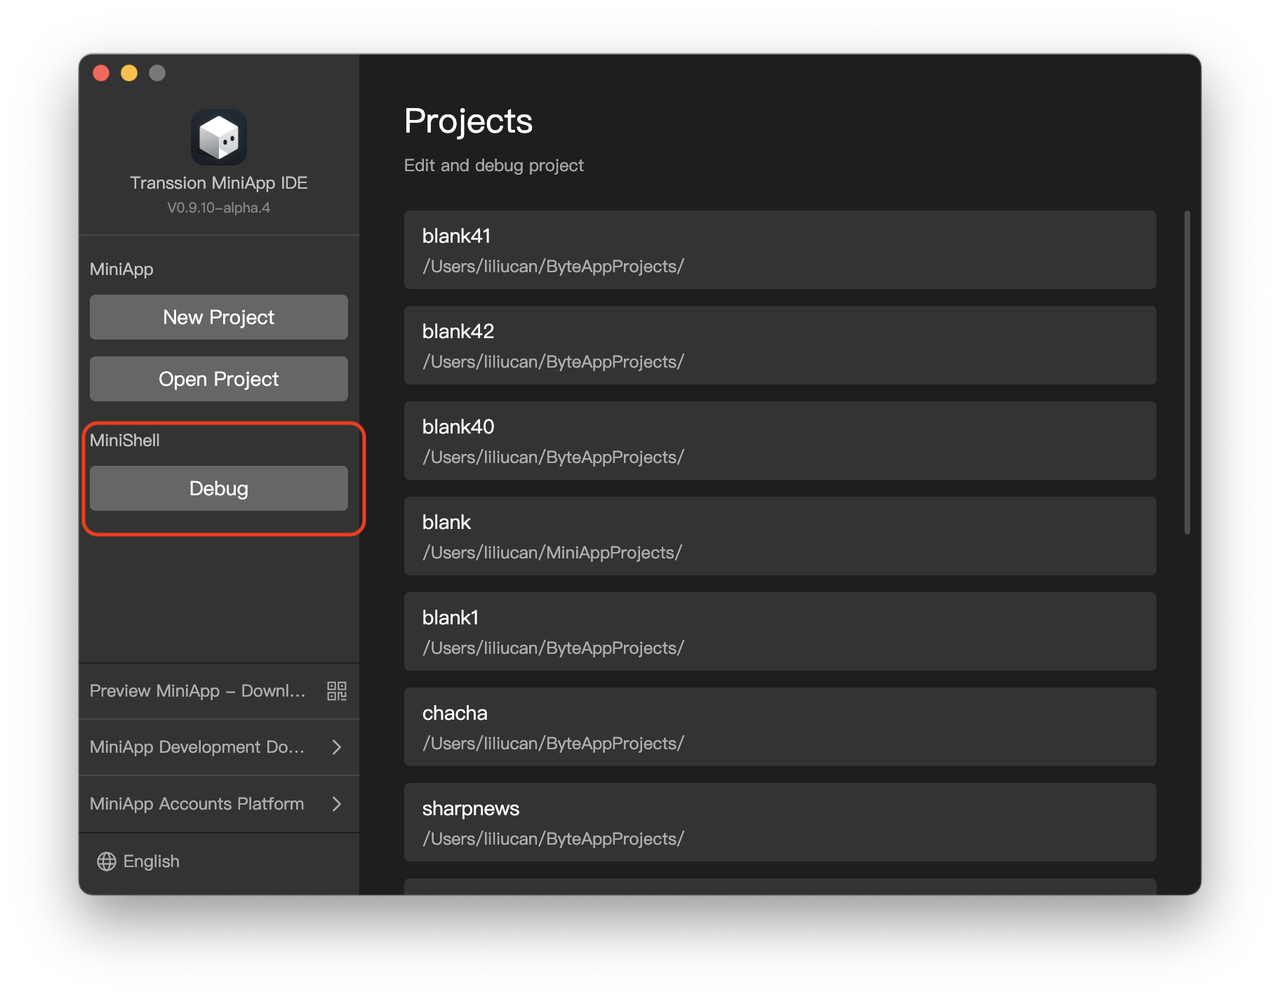
- Go to the startup page. Click on the "Debug" button in the MiniShell panel on the sidebar. The MiniShell debugging interface will be opened.

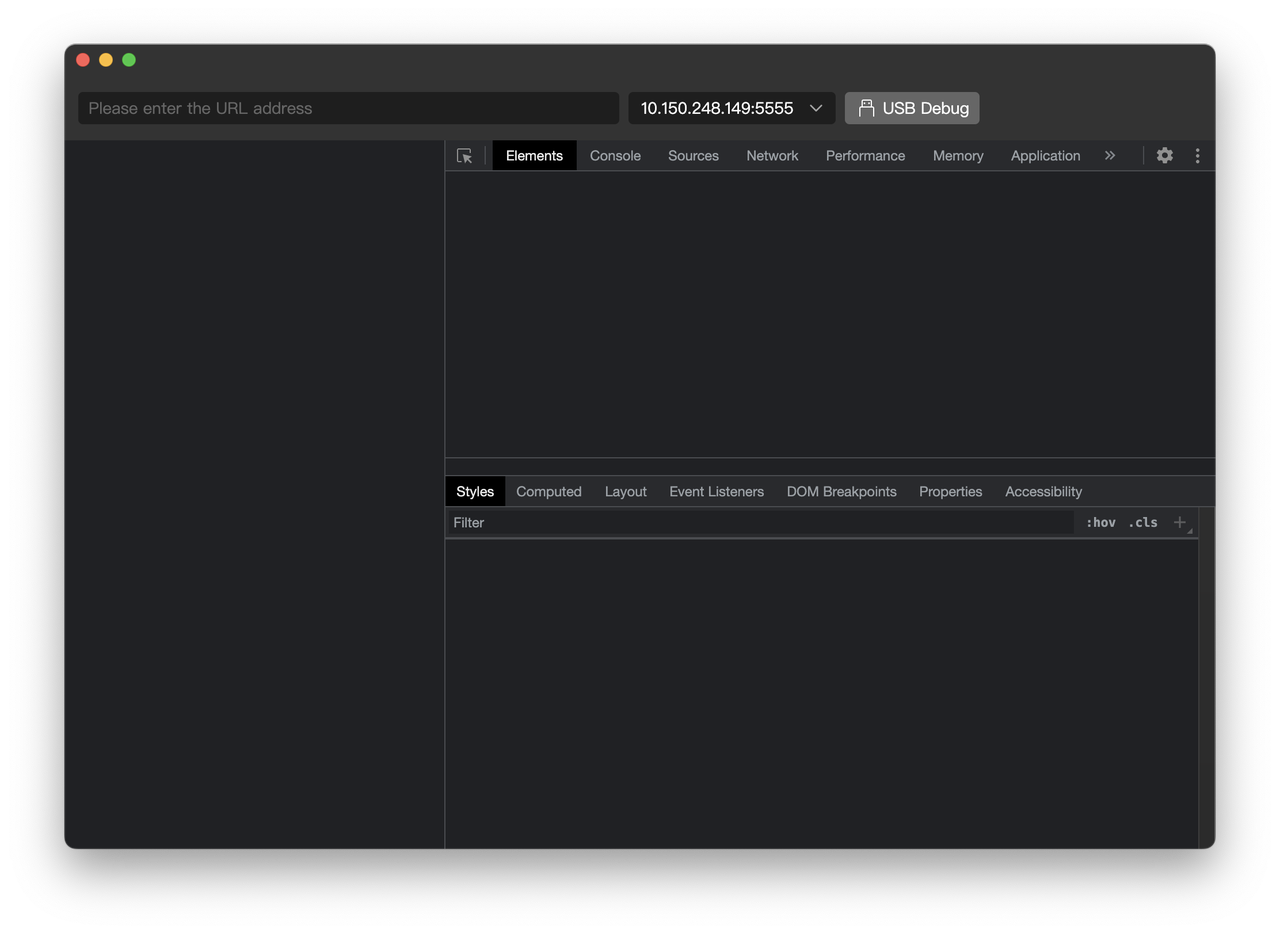
- The debugging interface of an H5 Shell MiniApp:

Debug an H5 Shell MiniApp
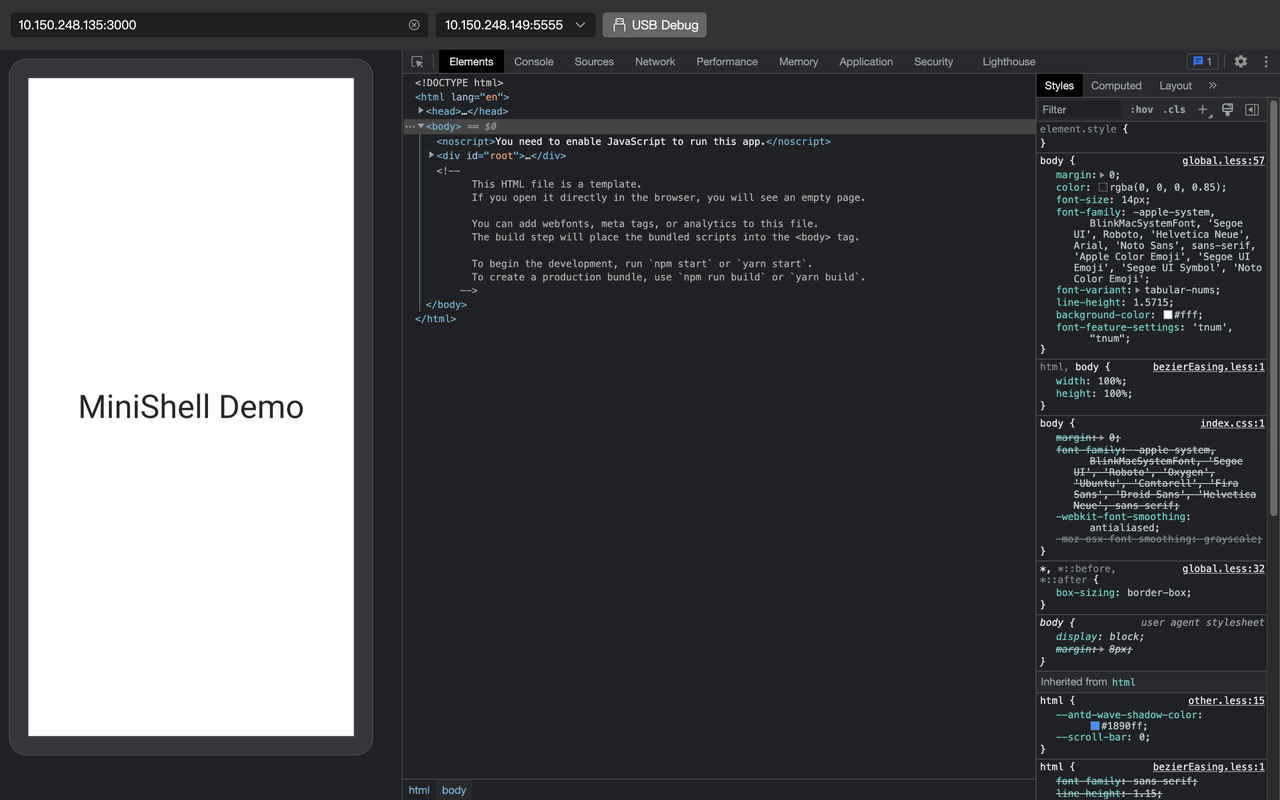
- Enter the URL of the H5 webpage you want to debug in the URL input box;
- Clicking on the "USB Debug" button will open the URL entered in Step 1 on the connected Android phone;
- The debugging tool will establish a connection with the H5 opened on the Android phone and display corresponding information on various panels;
- If you are debugging a local service and have configured Hot Reload, any modifications made to the local project will trigger automatic refresh of the H5 without the need to click the "USB Debug" button again.

Notes:
When using UI interaction APIs such as dlt.showToast, dlt.showLoading, dlt.showModal, dlt.showActionSheet, etc., only the correct UI effects will be displayed on the Android phone, not on the Screencast panel of the debugging tool on the left-hand side.